Net revenue retention, written NRR in most software reporting and also called net retention rate, is the percentage of recurring revenue that a group of existing customers still produces one period later, counting upgrades and expansion as gains and downgrades and cancellations as losses. New customers are excluded by design. The formula is one line:
Net revenue retention = (starting recurring revenue + expansion − downgrades − churn) ÷ starting recurring revenue
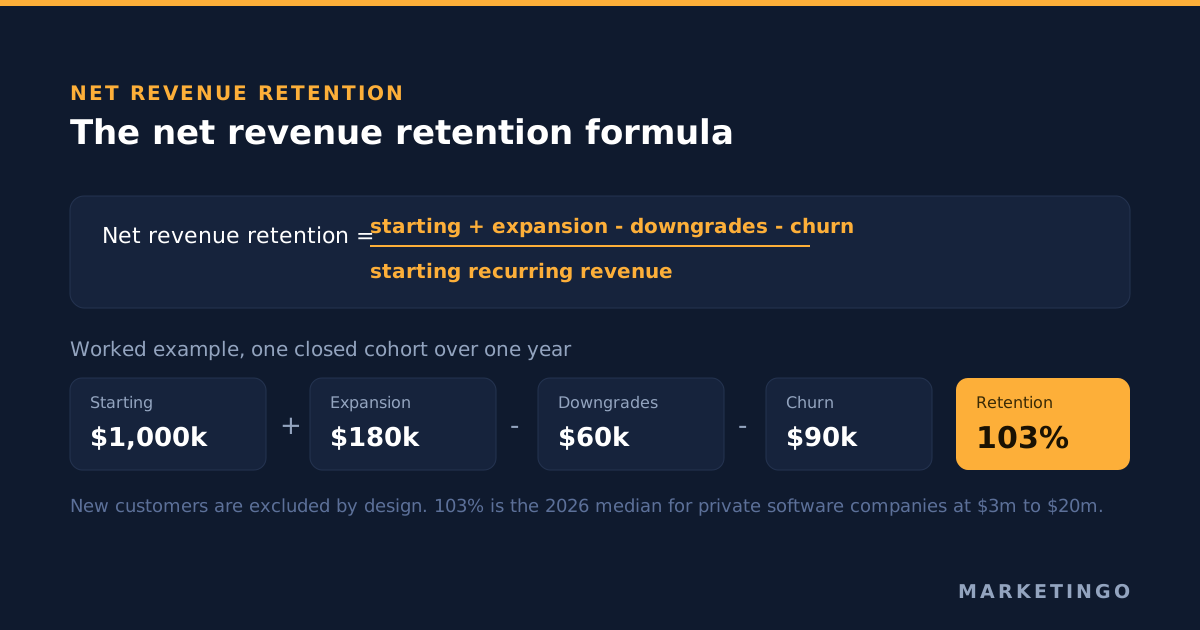
A cohort that started the year at $1,000,000 of annual recurring revenue, or ARR, added $180,000 of upgrades, lost $60,000 to downgrades and lost $90,000 to cancellations, ends at $1,030,000. Net revenue retention is 103%, which is the 2026 median NRR for private business-to-business software-as-a-service companies, or SaaS companies, between $3 million and $20 million of ARR, according to SaaS Capital's survey of more than 1,000 of them.
Hold that number next to the one you have probably been shown in a board deck, which is 120%. The gap between 103% and 120% is not a performance gap. It is a measurement artefact, and this article takes it apart.
What follows: what the metric counts and what it quietly leaves out, how to calculate NRR step by step, the difference between net and gross revenue retention and why the two must always be read together, the current NRR benchmarks from primary sources, where the 120% figure actually comes from, and the part that matters to anyone buying ads, which is how retention sets the ceiling on what you are allowed to pay for a customer.
What net revenue retention measures, and what it leaves out
NRR measures one thing: if we had stopped all sales and marketing a year ago and kept only the customers we already had, would the recurring revenue from existing customers be higher or lower today?
An NRR above 100% means the existing base grew on its own. Below 100% means the base shrank and new customers were paying for the shortfall before they paid for growth.
Three things are inside the number. Expansion revenue, meaning upgrades, seat growth, usage growth and cross-sells to customers who were already there. This is the revenue from upsells that lets NRR exceed 100%. Contraction, meaning downgrades, seat reductions and usage falling. And churn, meaning customers who left entirely.
One thing is outside it, and this is the omission that causes most of the misreading: revenue from customers acquired during the period is excluded. NRR is measured on a closed cohort. That is the whole point of it, and it is also why the SaaS metric everyone quotes is silent on whether acquisition is working. A company can report a high NRR, 115% say, while total revenue is flat, which simply means the existing base expanded and new business stopped. The two facts live in the same sentence in most reporting and describe opposite problems.
That omission is also why paid media cannot see NRR. Every channel metric, from cost per click through cost per lead to return on ad spend, stops at the first contract. NRR starts after it. The two halves of the same unit economics are measured by different teams, on different cohorts, in different reports, and then divided into each other to produce a lifetime-value-to-acquisition-cost ratio as though they came from the same place.
How to calculate NRR: the formula step by step
Pick the revenue base first. Most SaaS companies measure on annual recurring revenue; companies with monthly contracts measure on monthly recurring revenue and then annualise. Neither choice is wrong, but mixing them across periods produces nonsense, and comparing your monthly figure to somebody else's annual figure produces more.
The four inputs, measured on the customers who existed on the first day of the period:
- Starting recurring revenue. The contracted recurring revenue of the customers at the start of the period.
- Expansion. Upgrades, added seats, added usage, price increases taken by those same customers, and cross-sells into them.
- Downgrades. Contraction without cancellation: fewer seats, a cheaper tier, less usage.
- Churn. The recurring revenue of customers from that cohort who cancelled.
Then:
Net revenue retention = (starting + expansion − downgrades − churn) ÷ starting
Worked on the cohort above: (1,000,000 + 180,000 − 60,000 − 90,000) ÷ 1,000,000 = 1.03, so 103%.
Three rules keep it honest.
Never add new customers to the numerator. If a new logo signed in March appears in the December figure, the metric stops being a retention measure and becomes a growth measure wearing its name.
Keep the window fixed and state it. An annual figure and a two-year figure are different numbers for the same company. A company with an NRR of 103% a year retains 106.1% over two years, because retention compounds. Comparing a published two-year figure to your own annual one will understate your performance by several points for no reason other than arithmetic.
Measure on revenue, not on customers. Customer retention counts logos and treats a $200 account and a $200,000 account as equals. NRR counts the revenue retained in dollars. For a media plan the dollars are the relevant unit, because the dollars are what fund the next acquisition.
Net revenue retention, net dollar retention and net retention rate
Three names, one calculation. Net revenue retention, net dollar retention and net retention rate all describe the same ratio, and a SaaS metric that appears under three labels causes a surprising amount of confusion in benchmarking conversations.
There is no definitional difference worth managing between them. There is a reporting difference worth checking: the companies using the dollar phrasing are more often the ones measuring NRR over a trailing two-year window rather than one year, which makes their published figure higher than an annual one for reasons that have nothing to do with how well they retain customers.
A fourth term, logo retention or customer retention, is a different metric entirely. It counts customers rather than dollars, so a business that keeps 90% of its logos while losing its three largest accounts can report excellent customer retention and terrible revenue retention in the same quarter. When someone quotes a retention rate, the first question is always whether it counts customers or revenue, and the second is what window it covers.
How NRR relates to MRR, ARR and churn rate
Monthly recurring revenue and annual recurring revenue are amounts. NRR is a percentage calculated from them, so the two answer different questions and neither substitutes for the other.
MRR and ARR tell you the size of the business at a point in time. Total revenue growth tells you whether that size is increasing. NRR tells you how much of the change came from the customers you already had, which is the part of revenue growth that did not have to be bought again. A SaaS company growing ARR 40% a year with NRR at 95% is buying every point of that growth and will keep having to; the same growth at 115% NRR is partly self-funding, and the difference shows up in how much of the budget has to go to acquisition rather than anywhere else.
Churn rate is the mirror image of the retention side. Revenue churn rate is the percentage of starting recurring revenue lost to cancellations, so a 9% annual revenue churn rate and a 91% gross revenue retention rate are the same fact stated twice. NRR nets expansion against that churn, which is why NRR can sit above 100% while the churn rate is uncomfortable, and why reading NRR without the churn rate underneath it hides the problem described in the next section.
The practical rule: report ARR or MRR for size, total revenue growth for direction, gross revenue retention or churn rate for leakage, and NRR for whether the existing base is carrying its own weight. Four numbers, four questions, and most reporting collapses them into one.
Net revenue retention versus gross revenue retention
Gross revenue retention is the same calculation with expansion deleted:
Gross revenue retention = (starting recurring revenue − downgrades − churn) ÷ starting recurring revenue
It cannot exceed 100%, because nothing in it can add revenue. It measures leakage alone. NRR measures leakage and growth netted against each other, which is why it can exceed 100% and why a high NRR can also conceal a great deal.
Reading either one alone is the single most common error in this metric, and it is easy to show why.
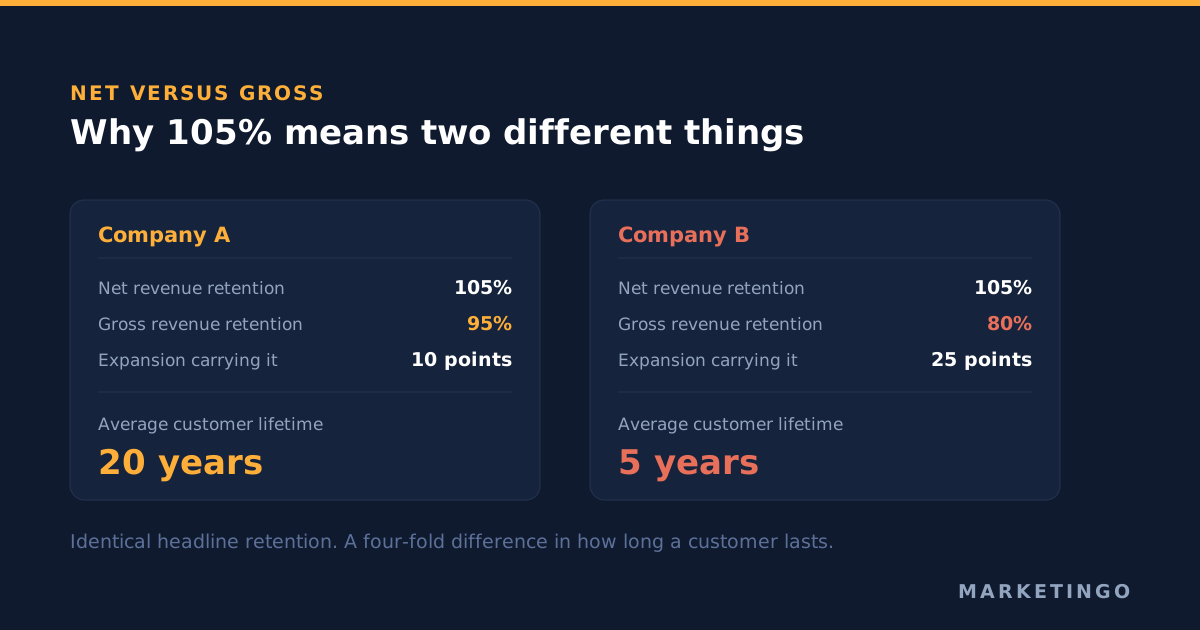
Two companies both report an NRR of 105%.
The first has gross revenue retention of 95% and ten points of expansion. It loses one dollar in twenty and grows the rest. At 95% gross retention the average customer relationship lasts one divided by 0.05, which is twenty years.
The second has gross revenue retention of 80% and twenty-five points of expansion. It loses one dollar in five every year and papers over the hole by selling harder to the customers who stayed. At 80% gross retention the average relationship lasts one divided by 0.20, which is five years.
Same headline. A four-fold difference in how long a customer lasts. And two completely different acquisition problems: the second company has to win new revenue worth a fifth of its base every single year just to stand still, which means a far larger share of its budget is defensive, and its expansion strategy is self-limiting, because no cohort can be upsold by twenty-five points indefinitely.
The gap between the two numbers is the diagnostic. In SaaS Capital's 2025 retention study the median gross revenue retention was 91% against a median NRR of 101%, a gap of ten points. The 2026 bootstrapped figures show 91% gross against 103% net, a gap of twelve. A gap much wider than that is not a sign of strong expansion. It is a sign of churn being masked.
NRR benchmarks: what a good net revenue retention rate is in 2026
Two primary sources, both surveys of private companies rather than aggregator round-ups, and both opened and checked rather than quoted from a list.
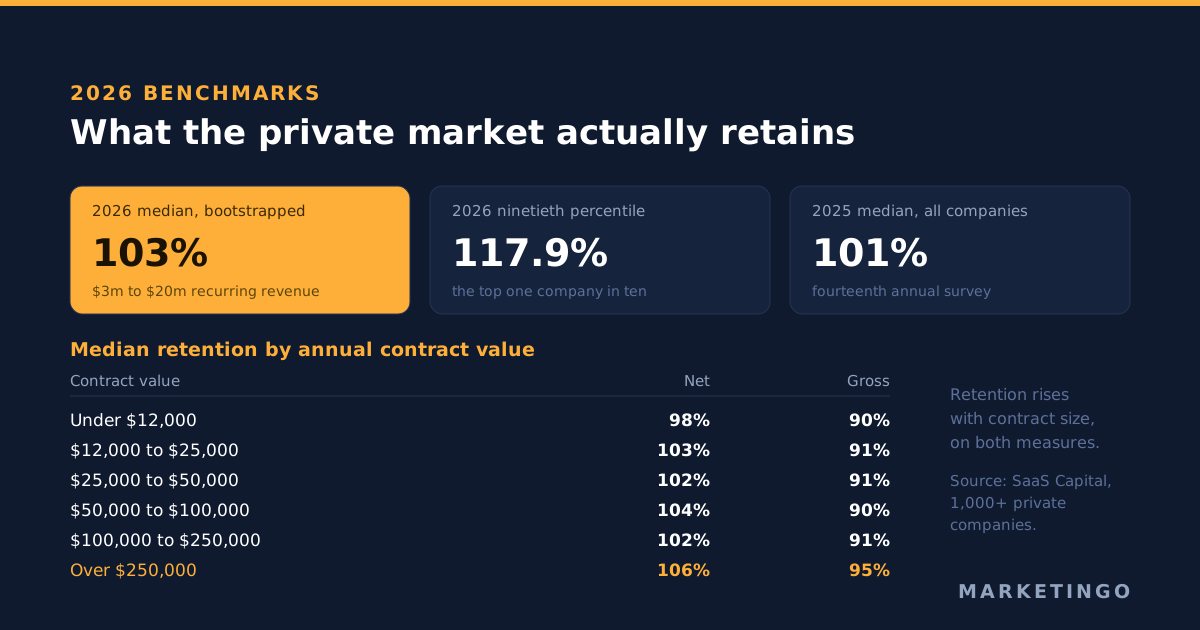
SaaS Capital's 2026 benchmarking metrics for bootstrapped software companies, published in April 2026 and drawn from more than 1,000 private business-to-business software companies, reports that for bootstrapped companies between $3 million and $20 million of annual recurring revenue the median net revenue retention is 103% and the ninetieth percentile is 117.9%. Median gross revenue retention is 91% and the ninetieth percentile is 100%.
SaaS Capital's 2025 B2B SaaS Retention Benchmarks, its fourteenth annual survey, puts the all-company medians at 101% net and 91% gross, and breaks net and gross retention down by annual contract value:
| Annual contract value | Median net revenue retention | Median gross revenue retention |
|---|---|---|
| Under $12,000 | 98% | 90% |
| $12,000 to $25,000 | 103% | 91% |
| $25,000 to $50,000 | 102% | 91% |
| $50,000 to $100,000 | 104% | 90% |
| $100,000 to $250,000 | 102% | 91% |
| Over $250,000 | 106% | 95% |
Companies under $1 million of annual recurring revenue are excluded from those retention figures.
Two things in that table are worth more than the headline medians.
Retention rises with contract size, and it rises on both measures. The top band retains 95% gross against 90% at the bottom, and 106% net against 98%. Larger contracts mean procurement, implementation and switching costs, and all three are retention mechanisms. This is a direct argument for targeting upmarket in paid media rather than chasing volume at the bottom, because the same acquisition dollar buys a longer and more expandable relationship.
The smallest band is below 100%. A company whose average contract is under $12,000 should expect its existing base to shrink slightly every year at the median, which means every dollar of growth has to come from new acquisition. Every dollar of growth has to be bought, which means these companies must acquire new customers continuously just to hold position. That is a fundamentally more expensive growth model, and it is the model most self-serve and small-business SaaS runs on.
The 120% benchmark does not describe your company
"Best in class net revenue retention is 120%" is repeated across SaaS metrics guides, investor blogs and customer success content as though it were a target an ordinary company should hold itself to. Checked against the primary data, it fails on two counts at once.
It is the top decile, not the standard. The ninetieth percentile of bootstrapped private SaaS companies between $3 million and $20 million of annual recurring revenue is 117.9%. So a figure of 120% describes roughly the best one company in ten, and the median company, at 103%, is seventeen points below it. Treating the ninetieth percentile as the benchmark means nine companies out of ten start every board meeting apparently failing at retention.
The companies the figure comes from are measured over a different window and priced on a different model. The published 120%-plus numbers are almost all public-company disclosures, and the clearest example is Snowflake. Its fourth quarter and full year fiscal 2026 results, for the year ended 31 January 2026, state a "Net revenue retention rate of 125%". Two details inside that filing change what the number means.
The first is the window. Snowflake's own definition of the metric uses the trailing two years from the period end, not one year. Retention compounds, so a two-year figure is always higher than the annual figure behind it. A 125% two-year rate is the square root of 1.25 on an annual basis, which is roughly 112%. That is still strong, and it is eight points lower than the headline, and it sits just below the ninetieth percentile of the private companies above rather than far beyond it.
The second is the pricing model. Snowflake sells consumption: customers pay for the queries they run, so revenue expands when usage expands, without a salesperson closing anything. The same filing reports 733 customers with trailing twelve-month product revenue above $1 million. A SaaS company selling seats at $1,000 a seat has to win every dollar of that expansion in a negotiation, which is the difference between a high NRR that is earned and one that arrives on its own. Comparing a seat-priced retention rate to a consumption-priced one is comparing two different mechanisms and calling the difference performance.
The practical conclusion is not that 125% is fake. It is that the benchmark you should hold yourself to is your own prior year and the median for your contract size, both measured on a one-year window, and that any external figure needs its window and its pricing model checked before it goes into a slide. If you take one habit from this article, take that one.
Why investors and forecasters watch NRR
Before the media-buying consequence, it is worth being clear about why this number carries so much weight with everybody else in the business, because that is the frame a marketing team has to argue inside.
Investors pay close attention to NRR because it answers one question that no other SaaS metric answers: do existing customers become more valuable over time? A company whose base compounds on its own needs less capital to reach the same revenue, and the revenue it already has is worth more per dollar. That is why retention shows up in valuation multiples rather than only in operating reviews.
It is also the cleanest way to forecast future revenue. Next year's revenue from existing customers is this year's recurring revenue multiplied by NRR, before a single new deal. A company at $10 million of ARR with a high NRR of 115% starts next year at $11.5 million from the base alone; the same company at 95% starts at $9.5 million and has to acquire new customers worth $2 million just to match the first one. That two-million-dollar gap is the acquisition budget consequence of twenty points of retention, and it is the single most useful sentence to bring to a budget meeting.
Two cautions on using it this way. The forecast assumes next year's cohort behaves like last year's, which breaks whenever pricing, packaging or the customer mix has changed. And a high NRR carried by a handful of large accounts is a concentration risk wearing a growth metric's clothes, so forecast from the segment-level figures rather than the blended one.
Net revenue retention sets the ceiling on what you can pay for a customer
This is where the metric stops being a finance number and becomes a media-buying number, and it is the part most retention articles never reach.
The gross profit a cohort produces is a geometric series. Year one is the annual contract value multiplied by the gross margin. Year two is that figure multiplied by NRR. Year three is multiplied again. Over five years the total is the first-year gross profit multiplied by the sum of one plus the retention rate plus its square, cube and fourth power.
Take a $12,000 annual contract at an 80% gross margin, so $9,600 of gross profit in year one, and run it at three different retention rates.
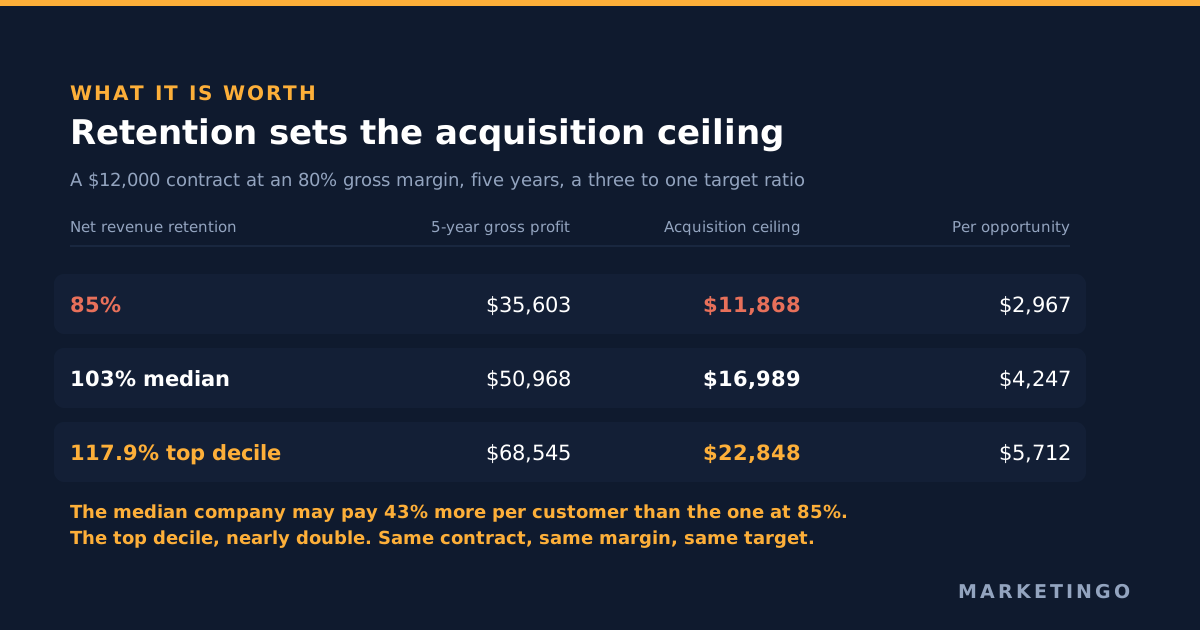
| Net revenue retention | Five-year cohort gross profit | Acquisition cost ceiling at 3:1 | Allowable cost per sales-qualified opportunity at a 25% close rate |
|---|---|---|---|
| 85% | $35,603 | $11,868 | $2,967 |
| 103%, the 2026 median | $50,968 | $16,989 | $4,247 |
| 117.9%, the ninetieth percentile | $68,545 | $22,848 | $5,712 |
Three companies in the same category, selling the same contract at the same margin, with the same target ratio. The median one may pay 43% more to acquire a customer than the one at 85% retention. The top-decile one may pay nearly twice as much.
That is the whole competitive argument in one table. In an auction, the bidder who can afford the highest cost per acquisition wins the impressions that matter, and retention is what pays for that affordability. A competitor outbidding you on every commercial keyword is not necessarily better funded. They may simply be keeping more of what they sell, which lets them buy traffic you have priced yourself out of.
Two honest caveats, because the arithmetic above is deliberately simple. It is undiscounted, so it overstates the later years; the discounted version of this calculation, and the reason the popular lifetime value formula overstates the answer by roughly three times, is worked through in our piece on the customer lifetime value formula. And it says nothing about how long the money takes to arrive, which is a separate constraint covered in CAC payback period. Lifetime value sets the ceiling; payback decides whether you can afford to reach it. Use both.
If you want the ceiling for your own numbers rather than this example, the lead generation return on investment calculator works the chain from deal value and close rate down to an allowable cost per lead.
Why a single retention number hides two different businesses
Beyond the gross-versus-net gap, two more decompositions are worth running before you trust a single figure.
Split retention by segment, not just by company. A blended NRR figure across the whole base is close to useless for media buying, in the same way a blended lifetime value is. Run it by contract size band, by industry, by acquisition channel and by plan. What usually appears is a base where one or two segments carry the whole number, with a high NRR in those and the rest sitting below 100%. Those segments are where the acquisition budget should go, and the ceiling table above should be recalculated per segment rather than once for the company.
Split expansion by whether you earned it or the customer's growth gave it to you. Seat growth because your customer hired forty people is not the same asset as an upsell your team sold. The first is a bet on your customers' markets; it inflates retention in a good year and reverses in a bad one. The second is repeatable. Companies that discovered this in 2023 and 2024, when software seat counts contracted across the technology sector, found that a large part of what they had been calling expansion was simply their customers' headcount.
What net revenue retention cannot tell you about acquisition
The metric is blind to the top of the funnel by construction, and three specific blind spots matter to anyone running paid media.
It says nothing about new-customer quality. A cohort's retention is only known a year after it was acquired, which means the channel that brought those customers in is being judged on a twelve-month lag. If you changed targeting last quarter, NRR will not tell you whether it worked until next year. The leading indicators that do, such as onboarding completion, first-value time and early product usage by acquisition source, have to be instrumented deliberately, and most accounts never send them back into the ad platforms as conversion signals. That is a tracking problem before it is a retention problem, and it is the single highest-leverage fix in most accounts we audit.
It cannot distinguish a pricing effect from a retention effect. A SaaS company that raised prices 8% across its base will show a higher NRR it did not earn through product or service. The honest version separates price from volume, and reports retention at constant prices alongside the headline.
It gives no credit for customers who come back. Resurrected customers, meaning accounts that cancelled and later returned, are normally counted as new, so they appear in acquisition and never in retention. Businesses with seasonal or project-based usage can look as though they churn heavily and acquire heavily when the same customers are cycling.
The ecommerce version, where nothing recurs
NRR is defined on recurring revenue, so a non-subscription store cannot calculate it as written. The equivalent is cohort revenue retention: take the customers who first bought in a given month, and express the revenue they produce in month thirteen as a percentage of the revenue they produced in month one.
The logic transfers exactly. Above 100% means last year's buyers are spending more this year than they did when they arrived, which raises what you can pay to acquire a buyer. Below it means every month starts further behind.
The two levers underneath it are order value and purchase frequency, which is why average order value and the repeat-purchase side of the base do more for an ecommerce acquisition budget than any bid adjustment. For the return on ad spend version of the same ceiling calculation, the ecommerce return on ad spend calculator handles the margin arithmetic.
How to improve net revenue retention with the levers paid media controls
Most advice on improving NRR belongs to product and customer success teams, and customer success does own the largest share of it. Three levers sit with acquisition, and they are the ones worth a media buyer's attention.
Acquire into the bands that retain. The benchmark table above is an instruction. If contracts over $250,000 retain 106% net and 95% gross, while contracts under $12,000 retain 98% and 90%, then shifting budget toward the targeting, keywords and creative that bring in larger accounts improves NRR without touching the product. In practice that means commercial-intent search terms, job titles with budget authority, company-size and revenue filters on LinkedIn Ads, and account lists rather than broad audiences.
Stop optimising to the cheapest conversion. Smart Bidding optimises to whatever conversion you feed it. Feed it raw form fills and it will find the cheapest form fills, which skew small, self-serve and short-lived. Feed it qualified opportunities or closed revenue by offline conversion import and it will bid toward the accounts that stay. This is the mechanism by which a conversion-tracking decision becomes a retention outcome, and it is explained in full in Google Ads conversion tracking.
Exclude the audiences that churn. Once retention is split by acquisition source, the segments that reliably churn can be excluded, negative-targeted or bid down rather than optimised. This is unglamorous and it works: a B2B SaaS company selling compliance and document security software lifted demo bookings 128% while cutting cost per conversion 11.2%, and the lift came from pushing budget toward the intent that converted rather than from broadening reach. Our approach to the whole category is set out on the software and artificial intelligence industry page.
Who should own net revenue retention
The question comes up in nearly every discussion of the metric, and the answer that holds up is that nobody owns it alone, because it has three independent inputs with three different owners.
Churn and the churn rate belong to customer success and product. Expansion revenue belongs to account management and sales. And the mix of customers entering the base, which is the input nobody attributes to retention, belongs to marketing and media buying. An NRR target handed to customer success alone will be missed if acquisition keeps filling the base with accounts that were never going to stay, and no amount of onboarding will fix a targeting decision made in an ad platform.
The useful operating version is a single figure reported monthly, decomposed into gross retention, expansion and new-cohort quality, with a named owner for each of the three rather than for the total.
When net revenue retention is the wrong metric to steer on
Three situations where the number is actively misleading.
Below about $1 million of ARR. The cohort is too small for the NRR figure to be stable. One departing customer can move it ten points, which is why SaaS Capital excludes companies under that threshold from its retention medians. Track logo churn and gross retention instead until the base is large enough.
In the first year of a new product or segment. There is no prior-year cohort to measure, and the number will be built from a handful of accounts.
When the business is not recurring at all. Project work, one-off high-ticket purchases and marketplaces need cohort revenue retention or repeat rate, not this metric with the definitions bent to fit.
And one standing caution that applies always: NRR is a lagging indicator of decisions taken a year ago. It is an excellent scoreboard and a poor steering wheel. The steering happens in the leading indicators, which is where the acquisition side can actually act.
Where to take this next
NRR is the variable that decides whether your acquisition budget is a growth engine or a treadmill. The sequence worth running, in order: calculate it properly on a one-year window, read it next to gross revenue retention and look at the gap, split it by segment, then recalculate your acquisition cost ceiling per segment with the table above and compare that ceiling to what you are actually paying today.
The companion metrics are customer acquisition cost, which is the number the ceiling constrains, and the lifetime value to acquisition cost ratio, which is the test the two numbers are put to. The rest of the profit metrics we work from sit on the resources hub.
If the arithmetic above says your allowable acquisition cost is well above what you are paying, you are probably under-investing in acquisition. If it says the opposite, the accounts need work before the budget does. Either way a free ad account audit will tell you which of the two it is in about a week, using your own numbers rather than a benchmark. We also publish what we look for in a Google Ads account audit checklist if you would rather run it yourself first, and the Google Ads service page describes how we work once an account is live.